The Bronx educates over 200,000 students across its diverse school system. Parents face a critical choice between charter and traditional public schools. This analysis examines performance data, teaching methods, and community impact. Both school types serve similar demographics yet employ different approaches.
The Educational Landscape
The Bronx operates 234 traditional public schools and 87 charter schools. Traditional schools enroll approximately 156,000 students. Charter schools serve 44,000 students. This represents a 22% charter school market share.
Demographics reveal striking similarities:
- 89% of students qualify for free or reduced lunch in both systems
- Hispanic students comprise 67% of enrollment across both types
- African American students represent 28% in both systems
- English Language Learners constitute 31% of the population
Academic Performance Metrics

Standardized test data from 2023 shows nuanced results. Charter schools demonstrate marginal advantages in some areas.
Table 1: 2023 Academic Performance Comparison
| Metric | Charter Schools | Traditional Public Schools |
| ELA Proficiency Rate | 43.2% | 38.9% |
| Math Proficiency Rate | 39.1% | 34.7% |
| 4-Year Graduation Rate | 81.3% | 76.8% |
| College Enrollment Rate | 68.4% | 61.2% |
| Chronic Absenteeism | 28.6% | 32.1% |
The mathematics achievement gap remains concerning across both systems. Only 37% of all Bronx students meet grade-level math standards. This underperformance limits future STEM opportunities.
Advanced educational platforms address this challenge. AI-powered tools like Statistics AI Solver provide personalized instruction in statistics and mathematics. These platforms offer step-by-step problem-solving guidance. They adapt to individual learning speeds. Such technology benefits students in both school types.
Teaching Methods and Innovation
Traditional public schools follow NYC Department of Education curricula. They maintain average class sizes of 25 students. Teachers receive 40 hours of annual professional development.
Charter schools exercise greater autonomy. Key differences include:
- Extended school days (average 8 hours vs. 6.5 hours)
- Flexible curriculum design aligned to state standards
- Innovative pedagogical models including project-based learning
- Higher teacher turnover rates (22% vs. 15% annually)
Both systems increasingly integrate technology. Digital learning platforms support differentiated instruction. Blended learning models show promise for improving outcomes.
Resource Allocation Analysis
Funding disparities persist between school types. Traditional public schools receive $28,423 per pupil. Charter schools receive $16,894 per pupil. However, charter schools often secure additional private funding.
Budget allocation priorities differ:
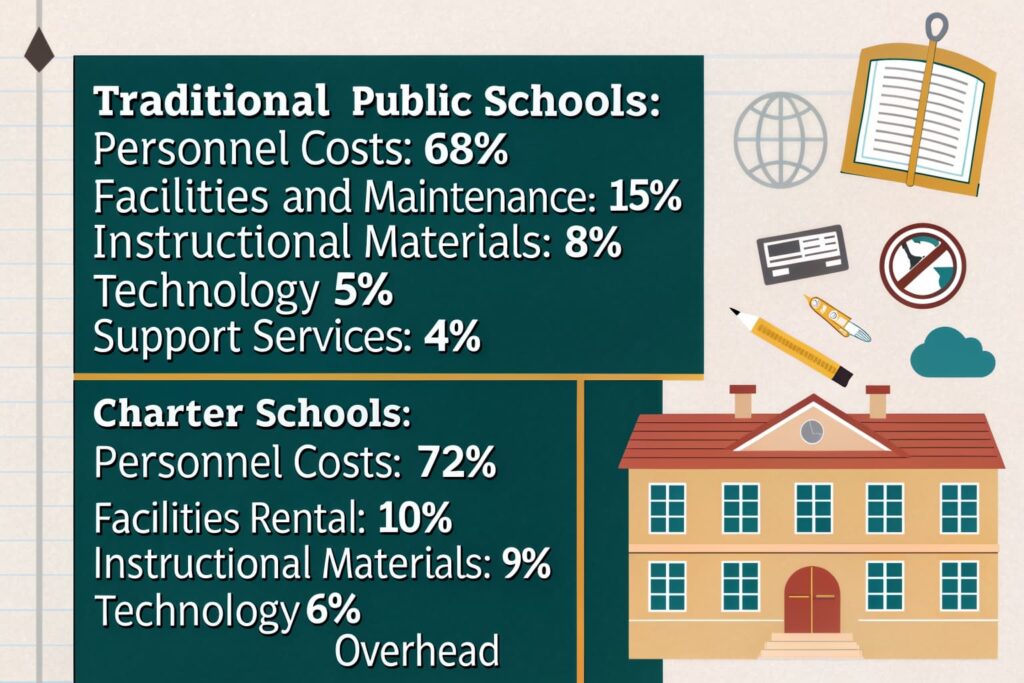
Traditional Public Schools:
- 68% – Personnel costs
- 15% – Facilities and maintenance
- 8% – Instructional materials
- 5% – Technology
- 4% – Support services
Charter Schools:
- 72% – Personnel costs
- 10% – Facilities rental
- 9% – Instructional materials
- 6% – Technology
- 3% – Administrative overhead
Community Impact and Accessibility
School choice affects Bronx neighborhoods differently. Traditional public schools guarantee enrollment within geographic zones. Charter schools use lottery systems. This creates transportation challenges for families.
Parent satisfaction surveys reveal mixed results:
- 71% of charter school parents report satisfaction
- 64% of traditional public school parents report satisfaction
- Transportation remains the top concern for both groups
Challenges and Opportunities
Both school types face common obstacles. Teacher recruitment proves difficult across the borough. Post-pandemic learning loss affects all students. Mental health support remains inadequate.
Unique challenges persist:
Charter Schools:
- Facility acquisition costs
- Authorization renewal pressure
- Limited access to district resources
Traditional Public Schools:
- Bureaucratic constraints
- Aging infrastructure
- Resistance to rapid change
Technology as an Equalizer
Educational technology bridges performance gaps. AI-driven platforms personalize learning experiences. They identify knowledge gaps instantly. Teachers receive real-time student progress data.
Implementation succeeds when schools prioritize:
- Reliable internet connectivity
- One-to-one device programs
- Teacher training on digital tools
- Parent engagement with technology
As an AI expert, I observe that intelligent tutoring systems particularly benefit struggling students. These platforms provide unlimited practice opportunities. They offer immediate feedback. Students build confidence through incremental progress.
Recommendations for Stakeholders
Parents should evaluate schools beyond test scores. Consider factors including school culture, extracurricular offerings, and support services. Visit schools personally. Ask about technology integration and individualized support.
Educators in both systems should embrace collaboration. Share best practices across school types. Leverage technology to enhance instruction. Focus on data-driven decision making.
Conclusion
The data reveals no clear winner between charter and traditional public schools. Both serve Bronx students with dedication despite challenges. Performance differences remain modest. School culture and fit matter more than school type.
Success depends on adequate resources, quality teaching, and family engagement. Technology offers promising solutions for both systems. The focus must remain on student achievement rather than institutional competition.
The Bronx education landscape will continue evolving. Informed parents and innovative educators will drive positive change. Every child deserves access to quality education, regardless of school type.